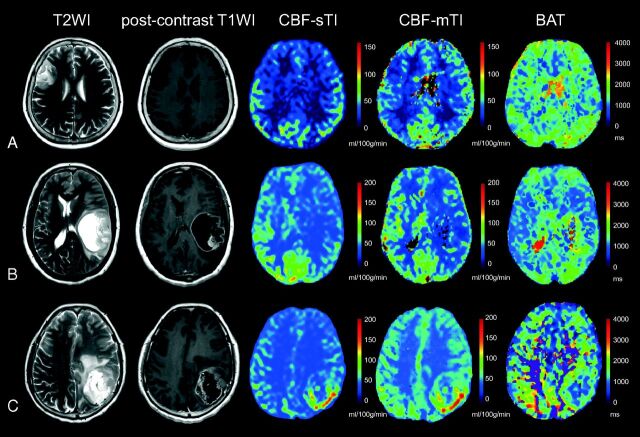
Fig 2.
Examples of the 3 different astrocytomas. A, A 60-year-old female patient with a diffuse astrocytoma (WHO II) in the right frontal-parietal region. The lesion demonstrates high signal on the T2-weighted image, a relatively low CBF value on both the CBF-sTI and CBF-mTI maps, and moderate signal intensity on the BAT map. No obvious enhancement is visible on the postcontrast T1-weighted image. B, Images from a 50-year-old woman with an anaplastic astrocytoma (WHO III) in the left temporal lobe demonstrate high signal intensity in the T2-weighted image and moderate enhancement in the postcontrast T1-weighted image for the solid part of the tumor. Both the CBF-sTI and CBF-mTI maps demonstrate low signal intensity, but the BAT value for the tumor areas is longer than that for the corresponding contralateral normal cerebral region. C, A 56-year-old female patient with a glioblastoma (WHO IV) in the left parietal lobe. The solid part of the tumor appears as an area of high signal intensity in the T2-weighted image and as obvious enhancement in the postcontrast T1-weighted image. Hyperperfusion is visible in both the CBF-sTI and CBF-mTI maps, and the BAT value is shortened.

