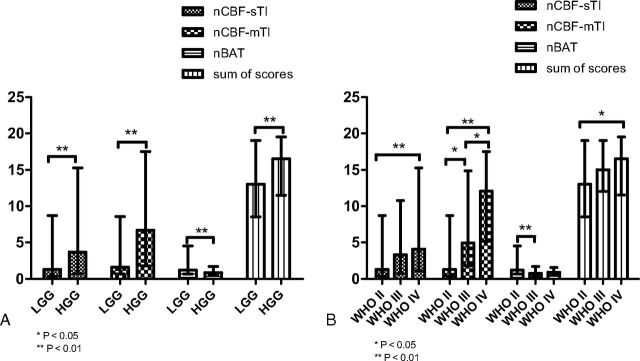
Fig 3.
The values of the different parameters are plotted as bar graphs by median and range. Significant differences between groups are indicated by asterisks. Error bars indicate the range. A, The bar graph shows the 4 indices of nCBF-mTI, nBAT, and nCBF-sTI and the sum of scores for the LGG and HGG groups. All indices indicate a significant difference between the LGG and HGG groups. B, The values in the bar graph show the parameters of each tumor grade. The nCBF-mTI shows significant differences between each pair of grades. The nBAT shows a significant difference between the WHO II and III groups. The nCBF-sTI and sum of scores show significant differences between only the WHO II and IV groups.

