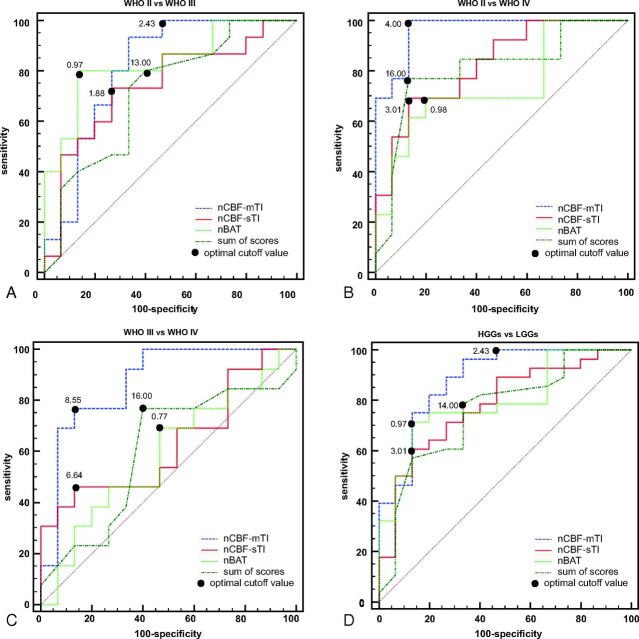
Fig 4.
Results of the receiver operating characteristic curve analyses. A, The receiver operating characteristic (ROC) curve for the nCBF-mTI, nCBF-sTI, nBAT, and sum of scores for MR imaging features in differentiating the WHO II and III groups. The nBAT has the best performance with an AUC of 0.836, followed by the nCBF-mTI with an AUC of 0.813, the nCBF-sTI with an AUC of 0.742, and the sum of scores with an AUC of 0.716. B, The ROC curves for the nCBF-mTI, nCBF-sTI, nBAT, and the sum of scores in differentiating the WHO II and IV groups. The nCBF-mTI has the best performance with an AUC of 0.964, followed by the nCBF-sTI, sum of scores, and nBAT, with AUCs of 0.826, 0.805, and 0.744, respectively. C, The ROC curves for the nCBF-mTI, nCBF-sTI, nBAT, and the sum of scores in differentiating the WHO III and IV groups. The nCBF-mTI has the best performance with an AUC of 0.872, followed by the nCBF-sTI, sum of scores, and nBAT, with AUCs of 0.631, 0.603, and 0.585, respectively. D, The ROC curves for the nCBF-mTI, nCBF-sTI, nBAT, and the sum of scores in differentiating the LGG and HGG groups. The nCBF-mTI has the best performance with an AUC of 0.883, followed by the nBAT, nCBF-sTI, and the sum of scores with AUCs of 0.793, 0.781, and 0.757, respectively.

