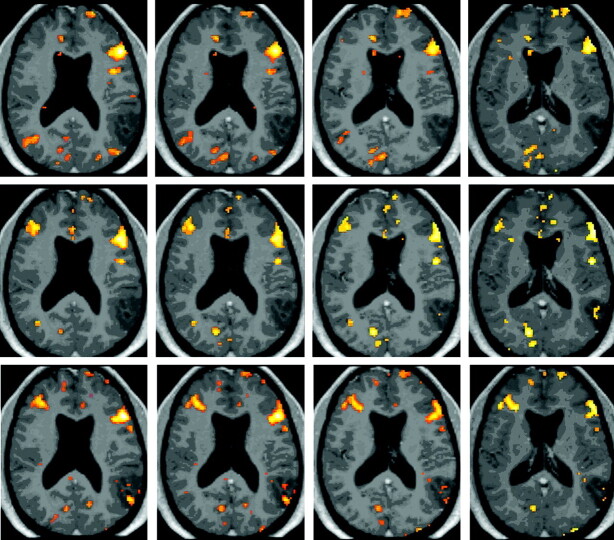
Fig 1.
BOLD activation maps (P < .001, 10-voxel clustering) for patient 1, who was scanned 2 weeks preoperatively (top row) and 5.5 (second row) and 15.5 (third row) months postoperatively with performance of an NV task. Both postoperative functional datasets are normalized to the initial preoperative anatomy with overlay of each postoperative BOLD activation map on the preoperative postgadolinium 3D MPRAGE anatomic image set, thus allowing evaluation of interval changes in topography of activation clusters in the same stereotactic space. Note the greater right middle frontal gyrus activation in the second scan compared with the preoperative scan, which is maintained in the third (ie, second postoperative) scan.

