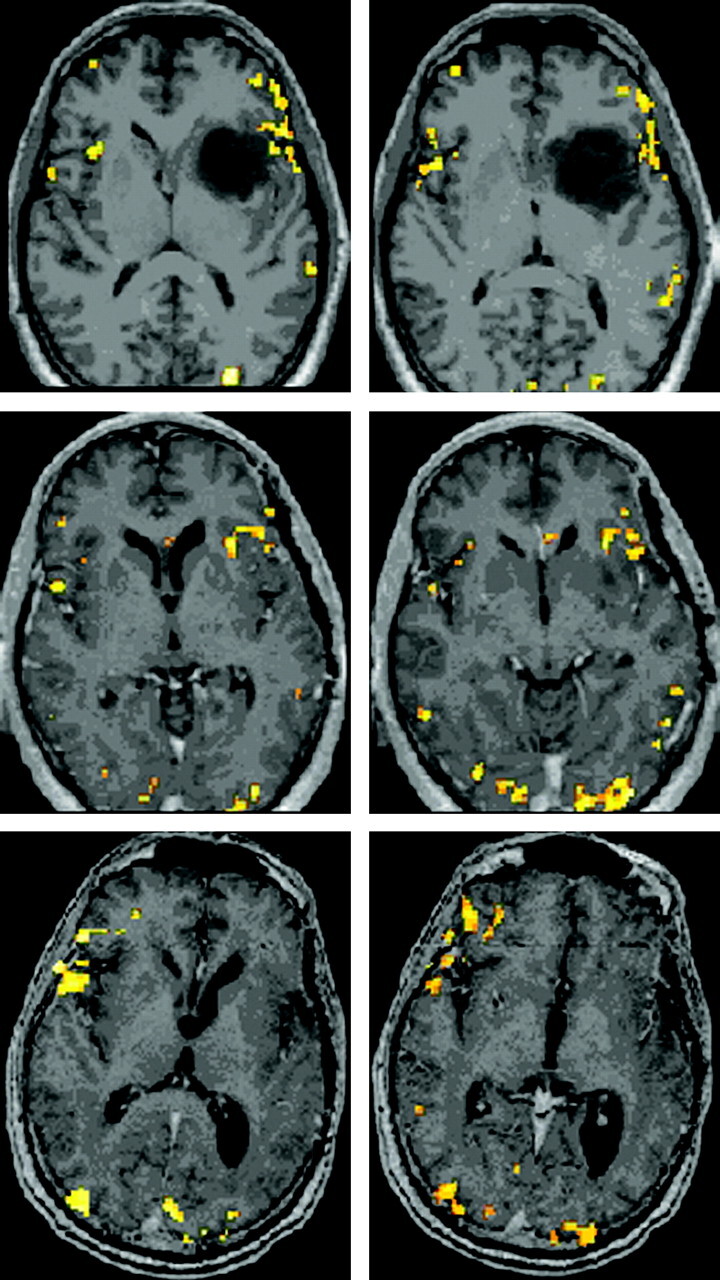
Fig 2.

BOLD activation maps (P < .001, 10-voxel clustering) for patient 2, who underwent left frontotemporal anaplastic astrocytoma resection; scans were obtained 2 weeks preoperatively (top row) and 5.5 (second row) and 31 months (last row) postoperatively, with performance of the identical P task. No normalization of data was performed, but instead postoperative functional maps were overlaid on actual corresponding postoperative postgadolinium 3D MPRAGE anatomic images from the same scanning session as the respective BOLD acquisitions. Note the more extensive and robust right inferior and middle frontal gyri activation in the second postoperative scanning session compared with the preoperative and first postoperative sessions.
