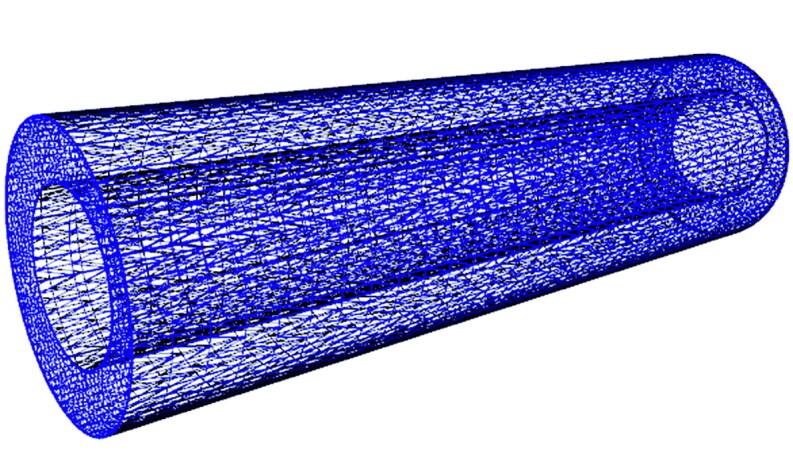
Fig 1.

An illustration of the computational model of the SAS used in the fluid dynamics simulations. The SAS is displayed as a series of connected points outside the spinal cord and inside the external boundary of the SAS. Flow and pressure are calculated for each point for a fluid with specific properties and flow rates. The number of points and their distance from each other determine the resolution of the computations and the length of time required for computation.
