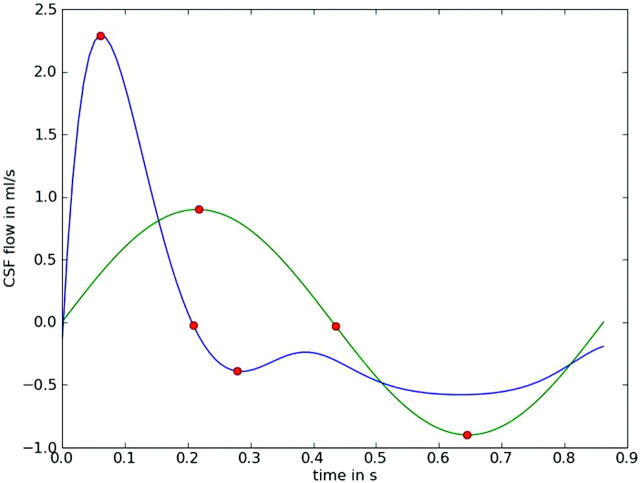
Fig 3.
Line graphs demonstrating different time courses for CSF flow that can be used as input functions in CFD simulations. The y-axis shows the magnitude of flow in positive and negative directions; the x-axis shows time as a decimal fraction of the cardiac cycle. One time course (green line) illustrates CSF flowing in a sinusoidal manner, similar to that observed in some PC MR studies.11 The other (blue line) illustrates CSF flowing in a less symmetric manner as observed in other PC MR studies.7 The 3 red points illustrate first the maximal velocity in a positive direction (systolic flow) and then the change in direction from a positive to a negative flow and then maximal negative (diastolic) flow. Systolic flow lasts a shorter time and has a greater magnitude than diastolic flow in the second plot. Net flow during the cardiac cycle is zero in both plots.

