Fig 6.
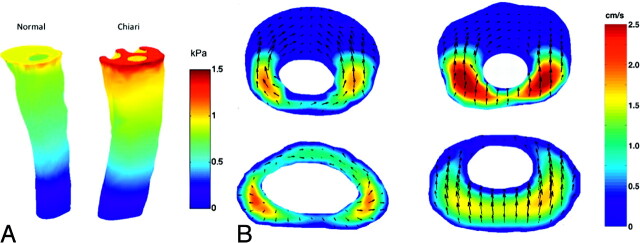
CSF flow velocities and pressures simulated in patient-specific models of the SAS for a healthy subject (left) and a patients with Chiari I (right). A, Pressure distribution at the inlet and along the outer spinal canal surface for the normal (left) and Chiari I (right) models during peak systole. B, Axial sections at the foramen magnum (upper images) and 4 cm lower in the spinal canal (lower images) are shown. The magnitude of flow through the axial section is indicated in centimeters per second by a color scale (reader's far right). The magnitude and direction of secondary (in section) flow are indicated by arrows. Flow is more inhomogeneous and faster in the patient with Chiari than in the healthy subject. Velocities are greater in both subjects at the foramen magnum than at the selected lower section. Courtesy of Alejandro Roldan.

