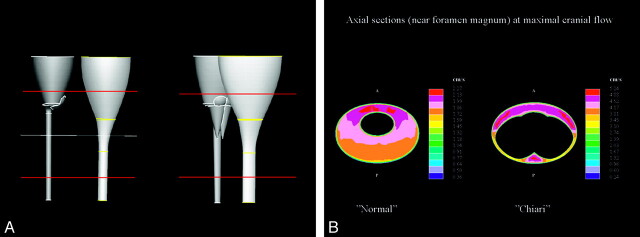
Fig 7.
Idealized models (above) of the brain, spinal cord, and SAS for simulating CSF flow in a healthy subject (left) and in a patient with Chiari (right). The red lines indicate the volume for which flow was calculated, and the yellow lines, the location of the axial section (below). In the axial sections, the flow patterns are heterogeneous in both the healthy subject (left in A and B) and the patient with Chiari (right in A and B). Peak velocities reach 2.27 cm/s in the healthy volunteer and 5.24 cm/s in the patient with Chiari (color scales to the right of the images).

