
Fig 2.
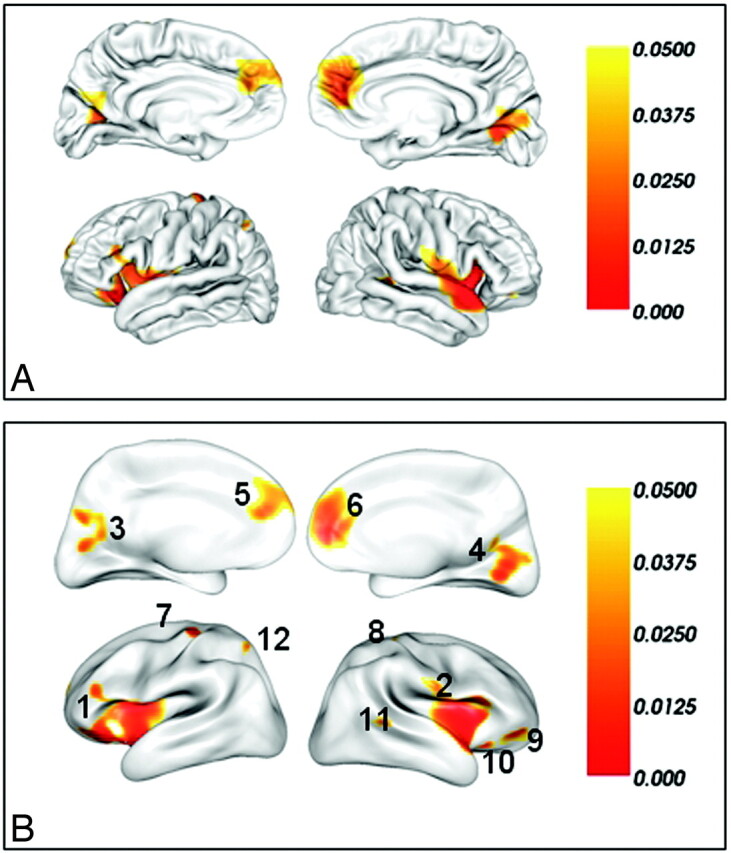
Brain regions of significantly reduced lGI in patients with MR compared with well-matched healthy subjects after a correction for multiple comparisons (P < .05, the vertex-based RFT correction) on the pial surface (A) and the inflated surface (B). The color bar indicates the vertex-wise P value after the correction for multiple comparisons. The integers in (B) are the cluster IDs corresponding to those of the Table.