
Fig 3.
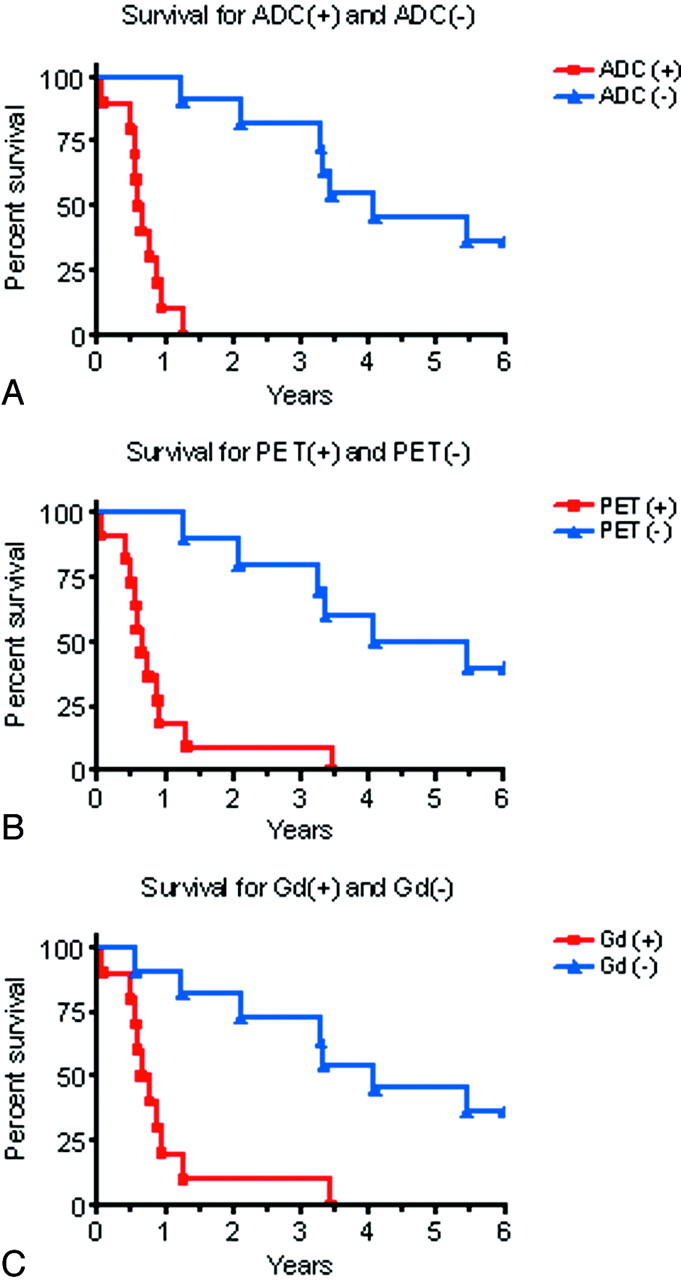
Top, Survival curves for the 10 patients with restricted diffusion on ADC maps and for the 11 patients without restricted diffusion on ADC maps, P < .0001. Middle, Survival curves for the 11 patients with increased FDG uptake on PET and the 10 patients with no increased FDG uptake on PET, P = .0004. Bottom, Survival curves for the 10 patients with gadolinium enhancement and the 11 patients without gadolinium enhancement.