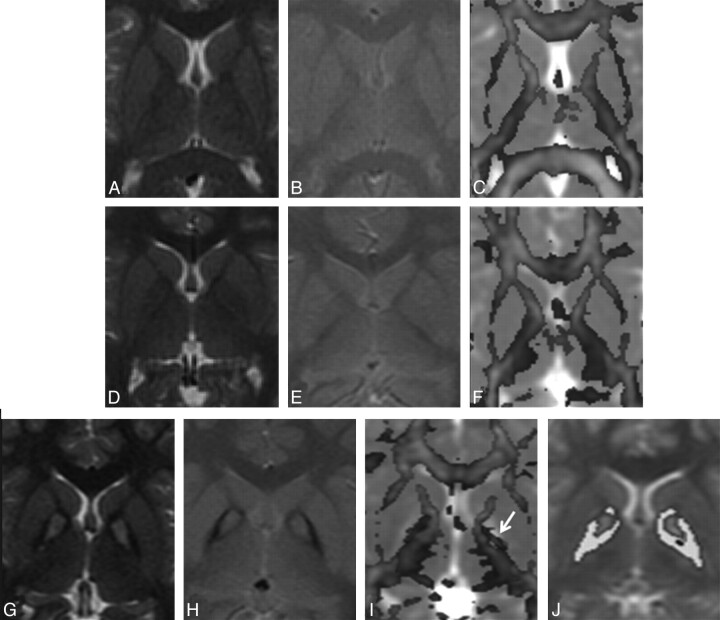
Fig 2.
A–C, MR imaging of a 6-year-old male healthy control shows normal distribution of white and gray matter on the T2-weighted image (A), the T2*-weighted GRE image (B), and the color-coded FA map overlaid on the MD map (C). D–F, A 6-year-old male sibling of the patient with PKAN G–J. Findings of T2-weighted (D) and T2*-weighted GRE (E) images appear normal in the sibling; however, the quantified color-coded FA map overlaid on the MD map (F) shows intermediate FA values between patients and controls. G–I, In a 10-year-old male patient with PKAN, T2-weighted (G) and T2*-weighted GRE (H) images show the eye-of-the-tiger sign. The color-coded FA map overlaid on the MD map (I) shows high FA values (arrow) in the GP (0.20) compared with those in both the control (0.10) and his sibling (0.12). J, Segmented FA map of the patient overlaid on T2. The hypointense regions are shown in yellow.

