
Fig 7.
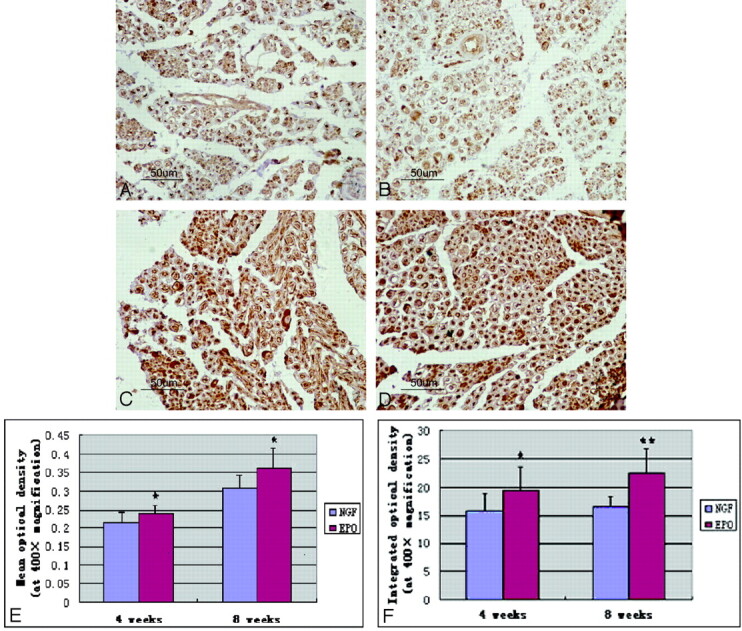
Representative photomicrographs of immunohistochemical staining of PGP 9.5 in regenerated sciatic nerve cross-sections. Axons and the periphery of the axons show strong immunoreactivity. A and B, Expression of PGP 9.5 in immunopositive nerve fibers at 4 weeks. C and D, Expression of PGP 9.5 at week 8. A−F, Quantitative analysis by using MOD and IOD reveals that nerves treated with EPO (B and D) have significantly higher MOD (E) and IOD (F) compared with those in the NGF group (A and C), and there are statistically significant differences between the 2 groups at the 2 time points. Data are the mean ± SEM. The asterisk indicates P < .05. Double asterisks indicate P < .01 compared with the NGF group significance.