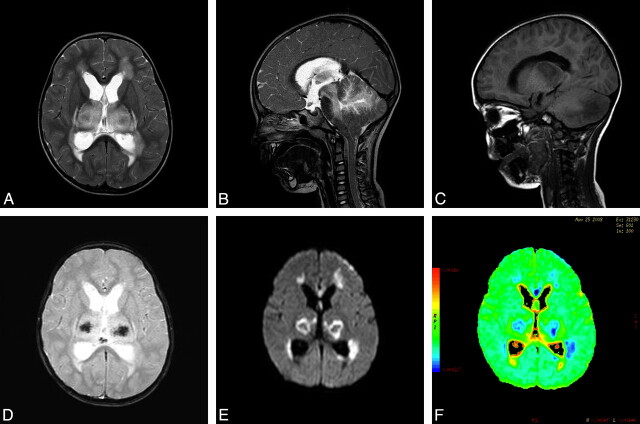
Fig 2.
MR imaging in the acute stage. A, Axial T2-weighted image shows symmetric increased signal intensity in the thalami and supratentorial frontal white matter. B, Sagittal T2-weighted image demonstrates hyperintensity in the cerebellum and the brain stem, including the midbrain and dorsal pons. Note tonsillar herniation and hydrocephalus before shunt surgery. C, Sagittal T1-weighted MR image shows hypointensity in the thalami and cerebellar hemisphere. D, T2-weighted gradient-echo image reveals decreased signal intensity in the central portion of the thalami, indicating hemorrhagic necrosis. E and F, Axial DWI and an apparent diffusion coefficient color-coded map reveal restricted diffusion, with a concentric pattern, symmetrically involving the thalami.

