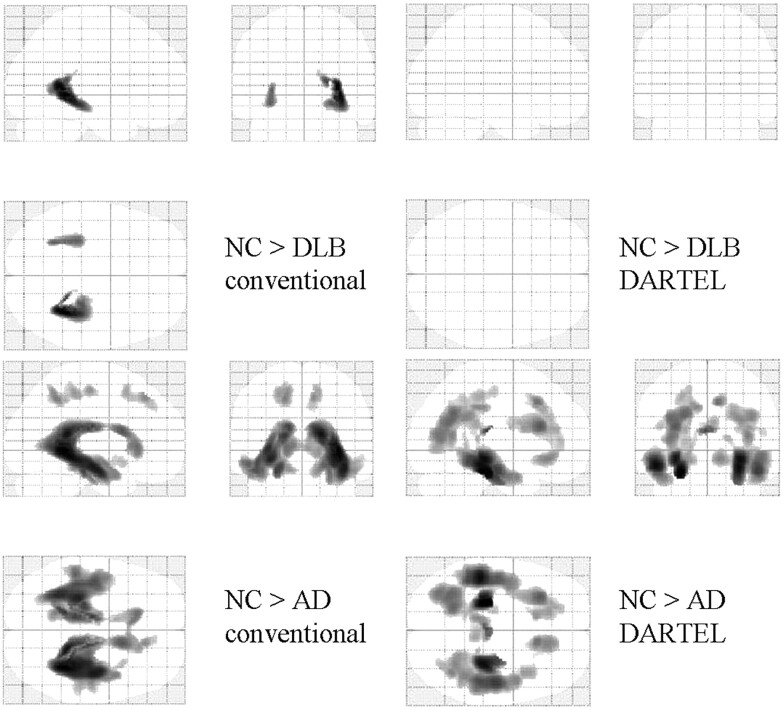
Fig 3.
Statistical parametric maps comparing the WM volume of patients with that of age-matched healthy controls (NC). Comparisons based on conventional VBM (left) and VBM-DARTEL (right) are both illustrated. Highlighted areas represent regions in which patients have significantly decreased WM compared with the controls (P < .001, uncorrected). Patients with AD show significant WM loss in the bilateral medial temporal, parieto-occipital, and frontal lobes. For patients with DLB, the regions in which significant decreases were identified differ between conventional VBM (upper left) and VBM-DARTEL (upper right). While WM decreases are not found in VBM-DARTEL−based comparisons, decreases in CSF, like WM, are identified in the deep brain with conventional VBM.

