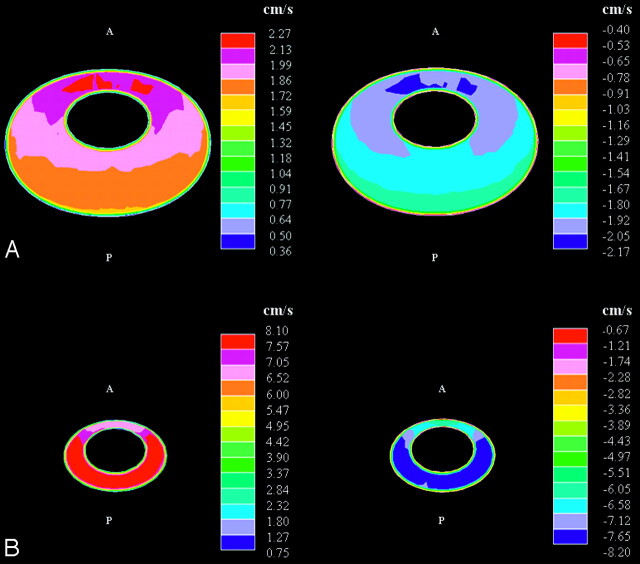
Fig 5.
Simulated cephalad-caudal flow velocities in axial sections at the craniovertebral junction (A) and at 6 cm below (B) at the time in the cycle of maximal cephalad (left) and of maximal caudal flow (right). The orientation of each section is as in Fig 3, that is, with the anterior (‘A’) side being upwards, the posterior (‘P’) side being downwards, and the caudal direction being into the page. Note the difference in scale for the 2 section levels. (Note that each color represents an interval of velocities, as specified in the scales to the right in the figure.)

