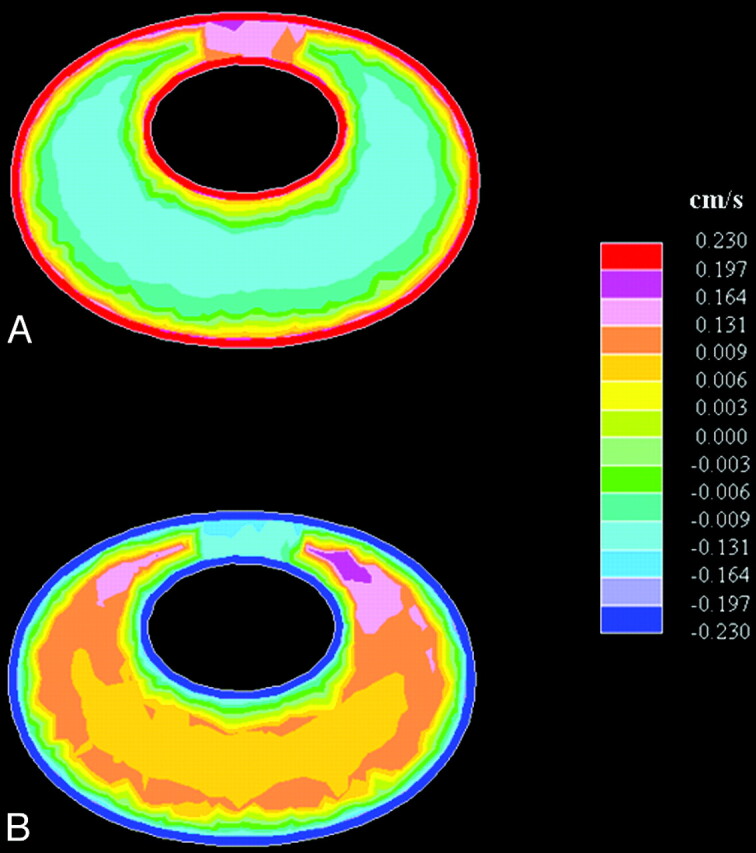
Fig 7.

Axial images showing bidirectional flow at the craniovertebral junction as flow direction turns from (A) caudal to cranial (ie, from negative to positive at t = 0.5 s) and from (B) cranial to caudal (ie, from positive to negative at t = 1.0 s). (Note that each color represents an interval of velocities, as specified in the scales to the right in the figure.)
