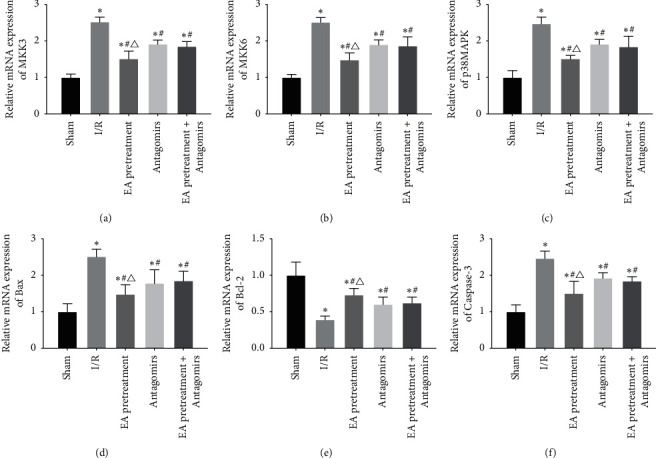
Figure 6.

Comparison of the expression levels of MKK3, MKK6, p38MAPK, Bax, Bcl-2, and Caspase-3 mRNA in the myocardial tissue of each group of rats (2– △△ Ct, x ± s, n = 10). ∗, P < 0.05 compared to the Sham group; P < 0.05 compared to the I/R group; P < 0.05 compared to the Antagomirs and EA pretreatment + Antagomirs group.
