
Figure 2.
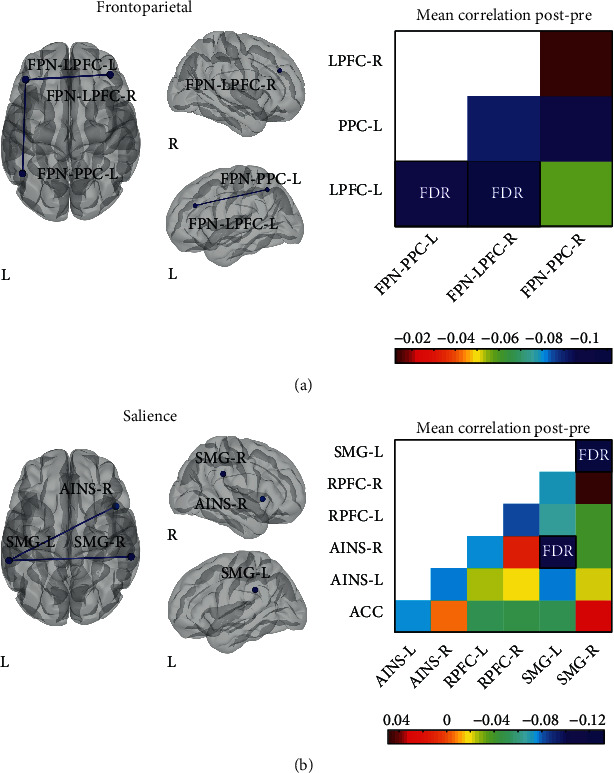
Changes in within-network connectivity induced by the neurological music therapy intervention. Nodes are overlaid on a rendered semitransparent brain generated using CONN. Connectivity matrices display the mean post- minus pre-intervention Fisher-transformed Z-score correlation values for each node. AINS: anterior insula; IPS: intraparietal sulcus; LAT: lateral; LPFC: lateral prefrontal cortex; MPFC: medial prefrontal cortex; OCC: occipital; PPC: posterior parietal cortex; RPFC: rostral prefrontal cortex; SMG: supramarginal gyrus; Sup: superior; R: right; L: left.