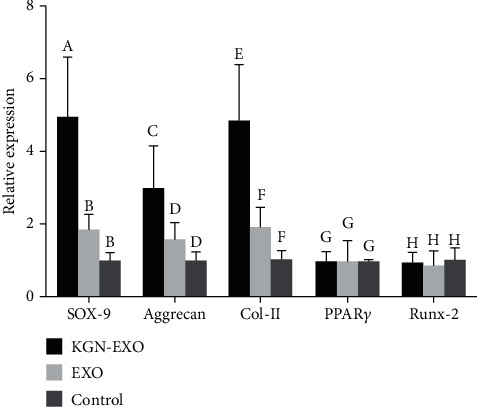
Figure 5.

qRT-PCR results showed that the expression levels of Sox-9, Aggrecan, and Col II were significantly increased after treatment with KGN-EXO and EXO. For all three genes, there were statistical differences between the KGN-EXO group and the control group (P < 0.05) and statistical differences between the KGN-EXO group and the EXO group (P < 0.05). Note that different letters above bars indicate significant differences (P < 0.05) while matched letters mean no significant difference in each comparison among the KGN-EXO/EXO/control groups.
