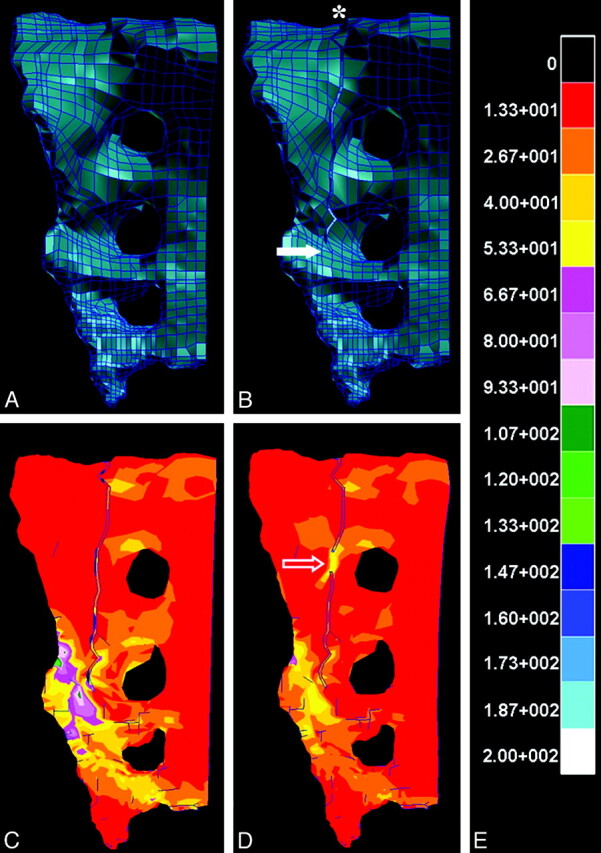
Fig 14.

A and B, Intact (A) and fractured (B) finite-element models of the hemisacrum constructed from cadaveric CT data, with the asterisk and solid arrow (B) indicating fracture origin and point of fracture propagation, respectively. C–E, FEA reveals kilopascals of stress experienced by the hemisacrum after application of a 35-kg load according to the calibration scale (E), both before (C) and after (D) simulated sacroplasty at a point along the fracture (open arrow, D). Note that the point of fracture fusion (open arrow, D) subsumes a portion of the stress generated by the 35-kg load and may explain the attenuated stress surrounding the site of fracture propagation compared with the presacroplasty model (C).
