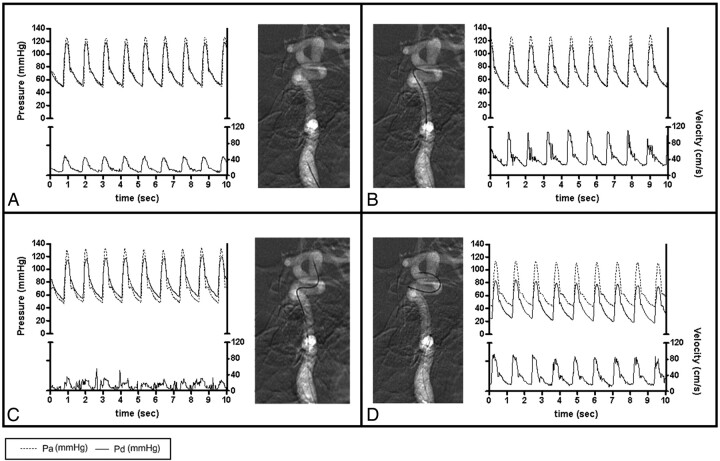
Fig 2.
BFV and pressure measurements using the ComboWire in the ICA at the cervical level (A), proximal to the aneurysm (B), intra-aneurysmally (C), and distal to the aneurysm (D). The graphs show matching flow velocity and pressure waveforms extracted from the ComboMap recordings. The upper part of each panel depicts pressure (mm Hg): systemic pressure measured in the radial artery (Pa) and intracranial pressure measured at the tip of the wire (Pd). The lower part of the graphs show flow velocity (centimeters per second). Sec indicates seconds.

