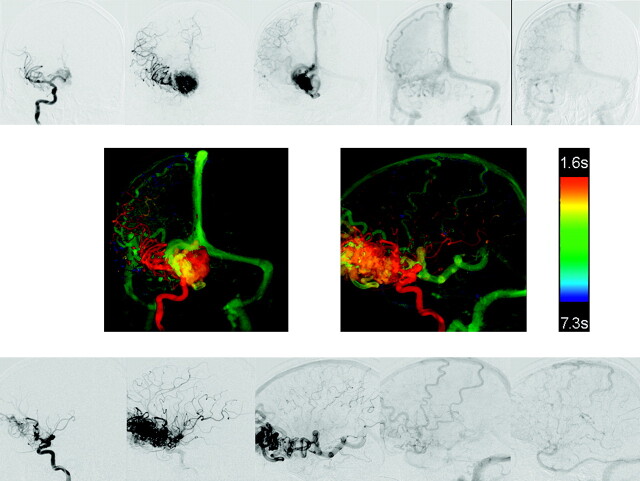
Fig 3.
AP and lateral DSA images from a right internal carotid angiogram from a patient with a large frontal AVM (top and bottom rows). AP and lateral color-coded images from these acquisitions (middle row). The complex circulation of this AVM is clearly depicted on the color-coded composite images.

