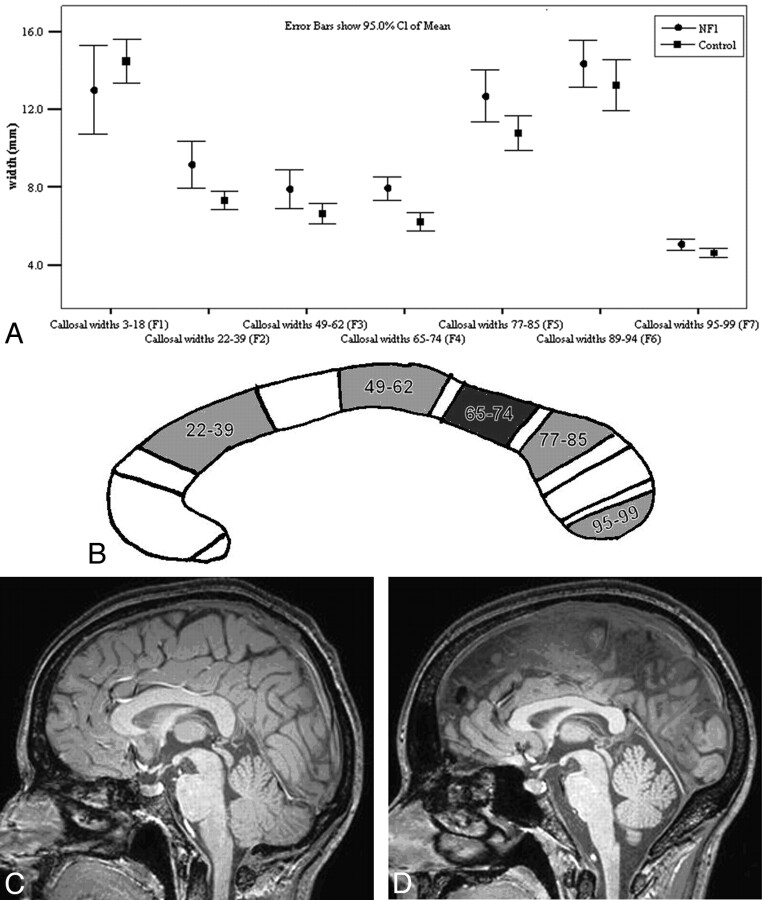
Fig 2.
A, The mean widths (±95% CIs) of the individual factors for both subjects with NF-1 and controls. B, Schematic representation of the regions of the CC that are statistically significantly wider in subjects with NF-1 compared with controls (white indicates not significant; light gray, significant to P < .05; and dark gray, significant to P < .005). C and D, Midsagittal images from the T1-weighted volume dataset from a person with NF-1 (C) and a matched control (D). The CC is visibly larger in the person with NF-1, particularly in the posterior aspect.

