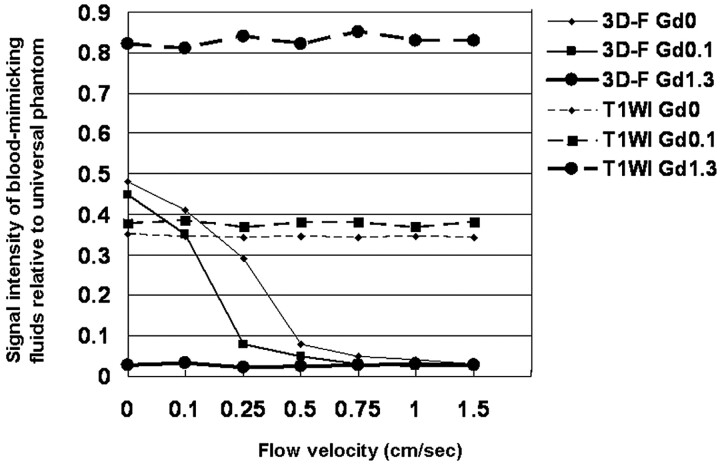
Fig 5.
Comparison of the signal intensity of blood-mimicking fluids relative to the universal phantom at various flow velocities on T1-weighted and 3D T2-FLAIR images. On T1-weighted images, the SI ratio at the 3 Gd concentrations is almost constant regardless of flow velocity. At no flow of the blood-mimicking fluids at concentrations of 0 and 0.1 mmol/L, the SI ratio is higher on 3D T2-FLAIR than on T1-weighted sequences. On 3D T2-FLAIR images at a Gd concentration of 1.3 mmol/L the SI ratio is extremely low regardless of flow velocity. At the concentrations of 0 and 0.1 mmol/L the SI ratio decreases rapidly with increasing velocity; at a flow velocity >1.0 cm/s, the SI ratio of blood-mimicking fluids at the concentrations of 0 and 0.1 mmol/L is as low as at 1.3 mmol/L. 3D-F Gd0 = 3D T2-FLAIR at 0 mmol/L of gadopentetate dimeglumine (Gd); 3D-F Gd0.1 = 3D T2-FLAIR at 0.1 mmol/L Gd; 3D-F Gd1.3 = 3D T2-FLAIR at 1.3 mmol/L Gd; T1WI Gd0 = T1-weighted imaging at 0 mmol/L Gd; T1WI Gd0.1 = T1-weighted imaging at 0.1 mmol/L Gd; T1WI Gd1.3 = T1-weighted imaging at 1.3 mmol/L of Gd.

