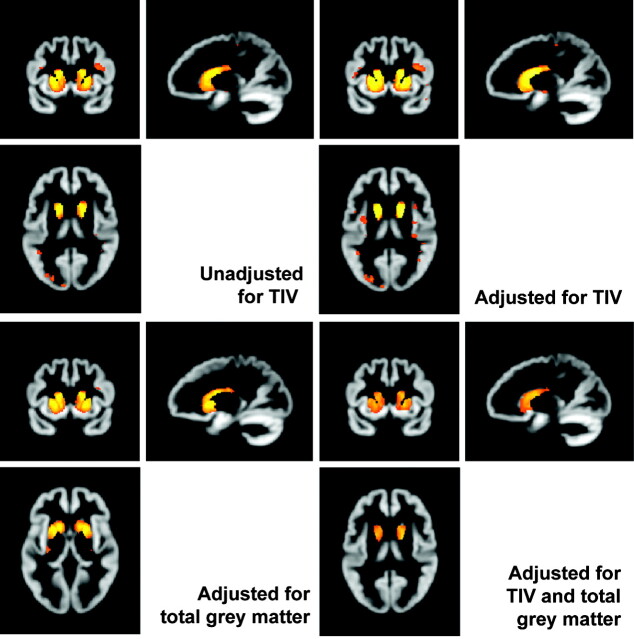
Fig 5.
Effects of adjusting for TIV with and without including total GM volume. All SPMs show early HD versus controls, corrected at FWE P < .05, smoothed at 4-mm FWHM. The top row shows the effect of including or excluding TIV as a covariate. The bottom row shows the effect of adjusting for total GM volume with and without TIV.

