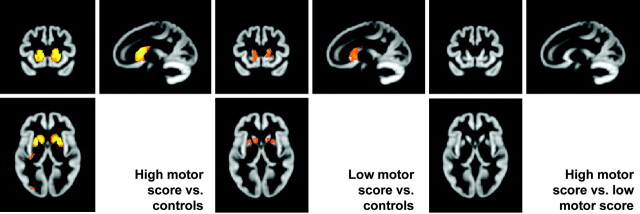
Fig 6.
Subgroup analyses. The left SPM shows regions in which a group of high motor scorers have reduced GM volume relative to matched controls. The center SPM shows regions in which a group of low motor scorers have reduced GM volume relative to controls. The right SPM shows the results when the high and low motor scorer groups are compared directly.

