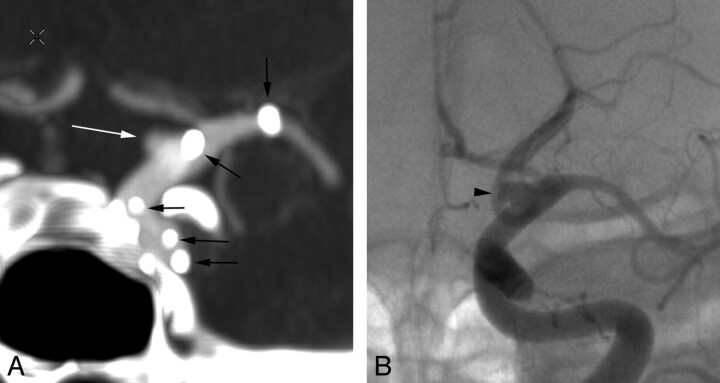
Fig 3.
Left supraclinoid ICA blister aneurysm posttreatment. Coronal MIP CTA image (A) shows the morphology of the residual blister aneurysm (white arrow), which again resembles its DSA counterpart (black arrowhead, B), though the dome of the aneurysm appears slightly more prominent on the DSA study (B). Note that the radiopaque tines of the overlapping stents used in the treatment are clearly seen on the CTA image (black arrows, A) but not on the DSA image.

