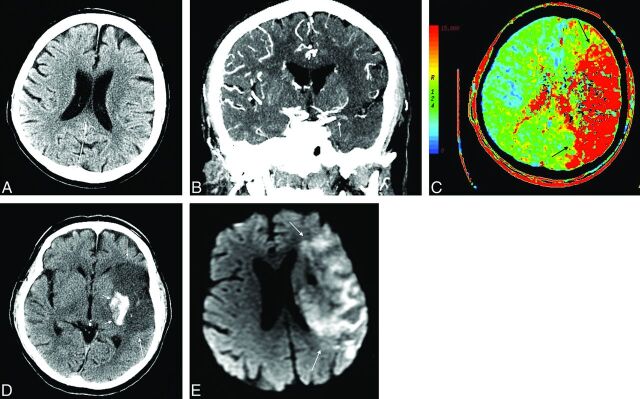
Fig 2.
A 69-year-old man who presented 179 minutes from symptom onset with right-sided acute stroke symptoms. Significant medical history included diabetes mellitus, hypertension, high cholesterol, and smoking. His baseline NIHSS score was 25. NCCT shows an ASPECTS of 6 (A). CTA shows occlusion of the M1 segment of the left MCA and proximal M2 segment of the left MCA (CBS = 4) (arrows) with a CS of 1 (B). The CTP MTT map shows perfusion abnormality involving almost the entire left MCA territory (C, arrows). He received rtPA. Twenty-four-hour CTA shows nonrecanalization of the occluded vessels (not shown), and follow-up DWI on day 5 shows a large infarct in the left MCA territory (E, arrows), similar in size to the initial perfusion deficit. NCCT shows hemorrhagic transformation in the left basal ganglia region (D, small arrows). Follow-up mRS was 4.

