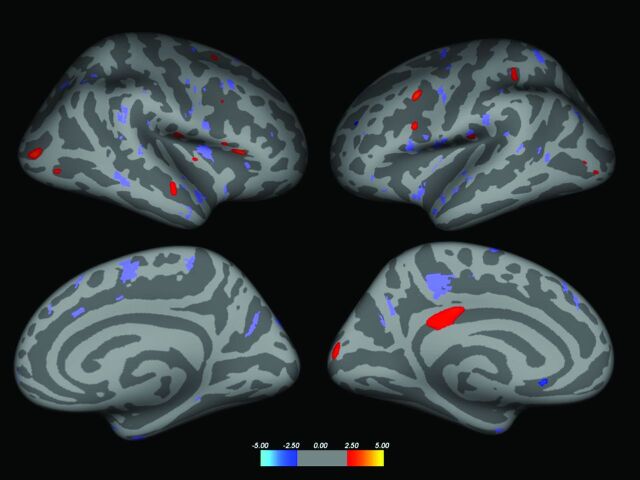
Fig 2.
Inflated brain, displaying areas of reduced cortical thickness (red areas) in CISj compared with CISnj (significance level P < .01 for display purposes). Blue areas indicate regions where cortical thickness in CISnj is reduced compared with CISj. The CIS JL lesion probability map was overlaid in purple (right column, left hemisphere; left column, right hemisphere; superior row, lateral view; inferior row, medial view). The JL lesion probability map is a binary mask for display purposes. No overlap was seen between the areas, showing significant changes in thickness and the JL lesion probability map.

