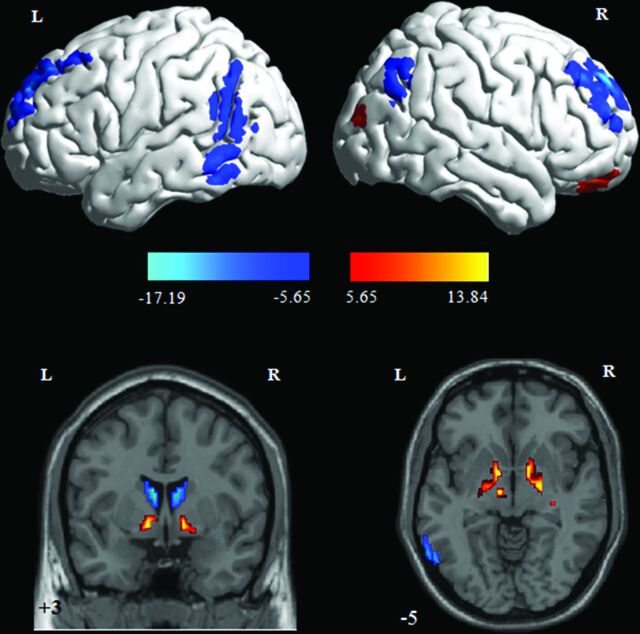
Fig 1.
Gray matter volume changes between patients with PD and controls. The warm color indicates increased gray matter volume for patients with PD in contrast to controls, while the cool color indicates decreased gray matter volume for patients with PD in contrast to controls. Color bars indicate t scores.

