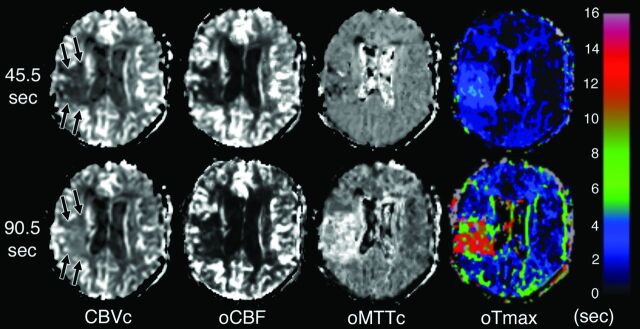
Fig 2.
Visual appearance of truncation artifacts resulting from scans of different durations. Sample perfusion maps produced from a single patient's perfusion data, which have been truncated to simulate perfusion scans of 2 different durations that are similar to those in common clinical use: 45.5 seconds (top row) and 90.5 seconds (bottom row) following contrast injection. The CBV map from the shorter 45.5-second scan shows a low-CBV lesion in the right frontal lobe (arrows, top row). However, the more accurate CBV map produced from the longer scan shows elevated rather than reduced CBV (arrows, bottom row). CBF maps produced from the 2 scan durations show little appreciable difference. The MTT map from the truncated scan shows almost no lesion, but there is a sizeable lesion with prolonged MTT in the map produced from the longer scan. The Tmax maps produced from the 2 scan durations show subjectively appreciable lesions of similar sizes. However, the color legend at the right of the figure shows that the abnormal Tmax values produced by the shorter scan are <6 seconds, so this tissue would not be classified as “at risk” by studies that use that threshold, whereas the longer scan produced a large lesion with Tmax values above the 6-second threshold.

