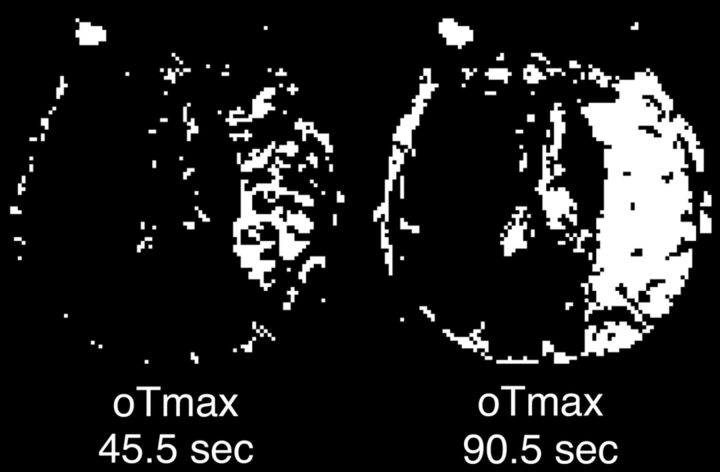
Fig 5.
Change in Tmax lesion volume resulting from truncation artifacts. Tmax maps produced from a single patient's perfusion data, which have been truncated to simulate perfusion scans of 2 different durations that are similar to those in common clinical use: 45.5 seconds (left) and 90.5 seconds (right) following contrast injection. High-contrast window settings were used to depict pixels with a Tmax of >6 seconds as white and other pixels as black. The 90.5-second scan demonstrates a large lesion that would be considered “at risk” by using the 6-second criterion and could potentially make the patient eligible for thrombolytic therapy. The 45.5-second scan shows a much smaller Tmax lesion. Tmax lesion sizes measured across all image sections for this patient were 430.2 mL for the 90.5-second scan and 79.2 mL for the 45.5-second scan.

