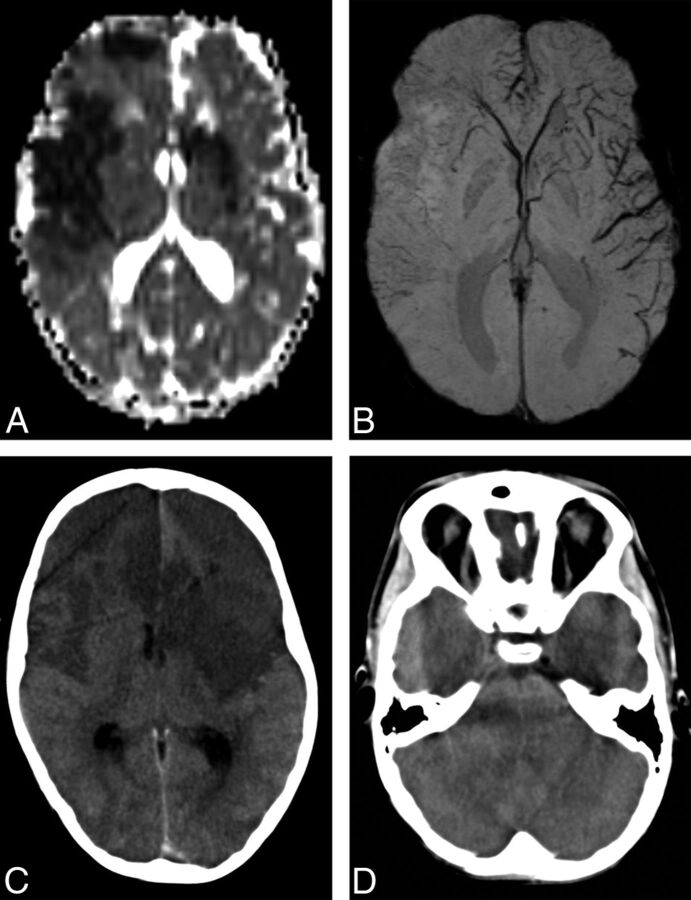
Fig 3.
A 7-year-old boy with AIS involving the right ACA and partial bilateral MCA territories. A, ADC map shows areas of restricted diffusion in the right ACA, M1, M2, M4, and M5 territories as well as the left M2, M4, and M5 territories. B, mIP-SWI shows markedly hyperintense sulcal veins in the right ACA, M1, M2, M4, and M5 territories and hypointense sulcal veins in the left M1, M2, M4, and M5 territories. C and D, Follow-up axial CT image 2 days after AIS shows stroke evolution in the right ACA, M1, M2, M4, and M5 as well as in the left M2, M4, and M5 territories. In addition, there is increasing mass effect with effacement of both frontal horns of the lateral ventricles, the third and fourth ventricles, and prepontine cistern, compatible with malignant edema.

