
Fig 1.
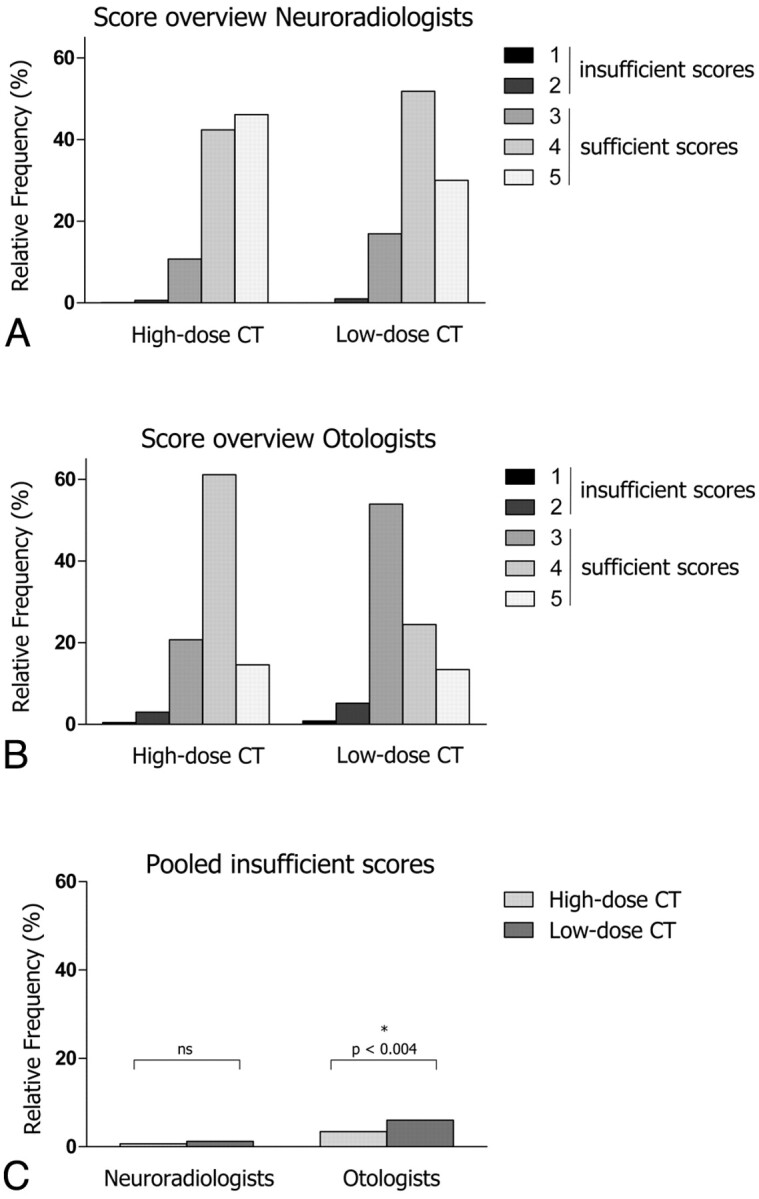
A and B, The relative frequencies of scores 1–5 are shown for the neuroradiologists (A) and the otologists (B) and for high-dose and low-dose CT. C, The pooled insufficient scores are shown for the neuroradiologists and the otologists for high-dose versus low-dose CT.