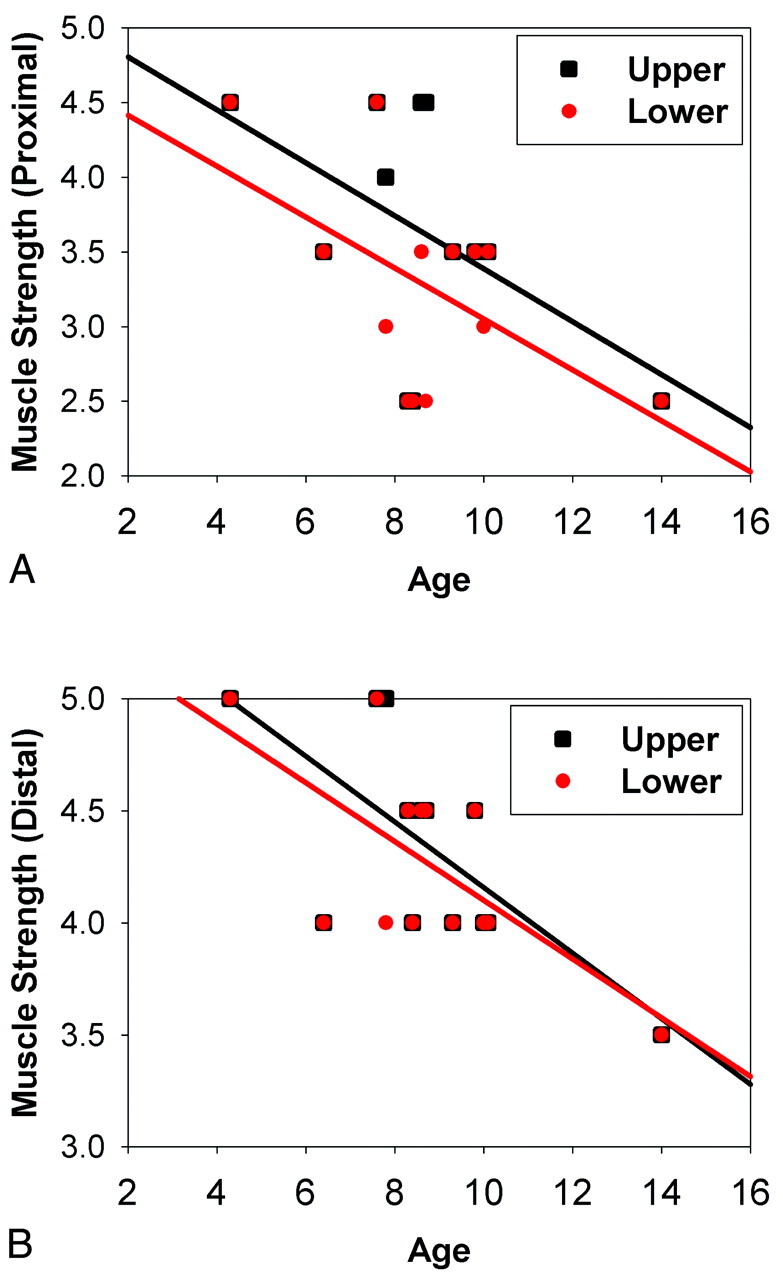
Fig 2.

Correlation between age and muscle strength in patients with DMD. A, Proximal limb. B, Distal limb. Black squares and regression lines indicate the correlations between age and the upper limb, while red dots and regression lines indicate the correlation between age and the lower limb.
