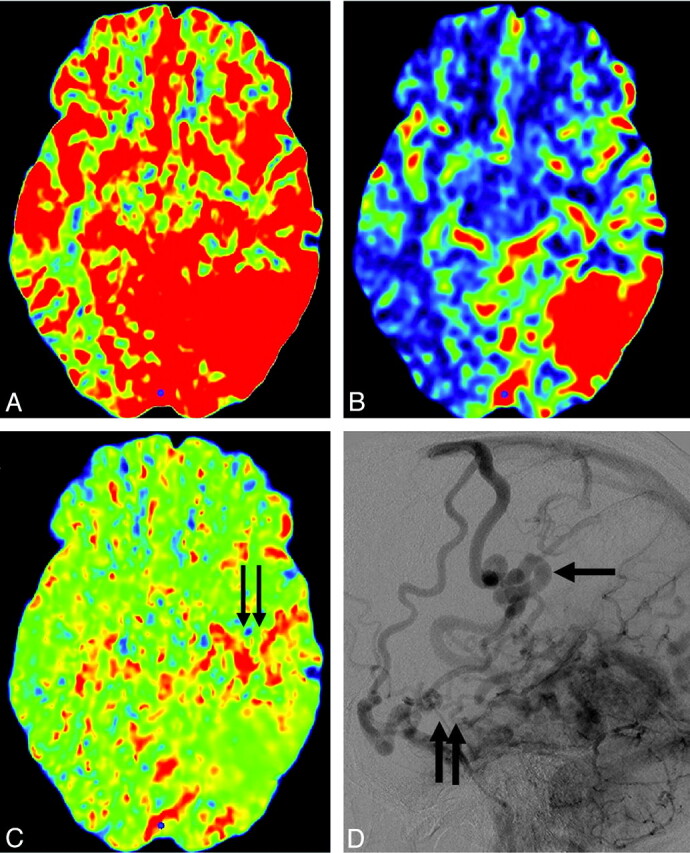
Fig 2.

Case 7. A−C, CBF, CBV, and MTT maps. Increased CBV and MTT are seen anterior to the nidus, which is suggestive of venous congestion (pattern 3, black arrows). D, Delayed phase of lateral conventional angiography shows tortuous engorged pial veins (pseudophlebitic pattern, black arrows) slowly draining anteriorly in addition to the main draining vein (arrow).
