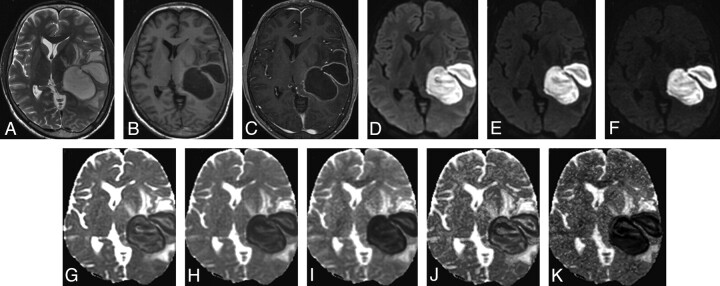
Fig 1.
A 16-year-old male patient with brain abscess. A, T2-weighted image shows bilobed centrally hyperintense lesions with a peripheral hypointense rim and surrounding edema in the left tempoparietal region causing mass effect. B and C, The lesion shows central hypointensity with a peripheral isointense rim on the T1-weighted image (B) and rim enhancement on the postcontrast T1-weighted image (C). D−F, DWI at b-values of 1000 (D), 2000 (E), and 3000 s/mm2 (F), respectively, show intense hyperintensity inside the lesions with maximal suppression of free water at 3000 s/mm2 (F). G−I, ADC maps generated from DWI at different b-values (1000, 2000, and 3000 s/mm2) show a decrease in signal intensity inside the lesions with increasing b-values, suggestive of maximal suppression of extracellular water. J and K, The fast (J) and slow (K) component ADC maps derived from the biexponential fit in the abscess cavity have values of (1.11 ± 0.06) × 10−3 s/mm2 and (0.15 ± 0.23) × 10−3 s/mm2, respectively. Pus culture showed S aureus.

