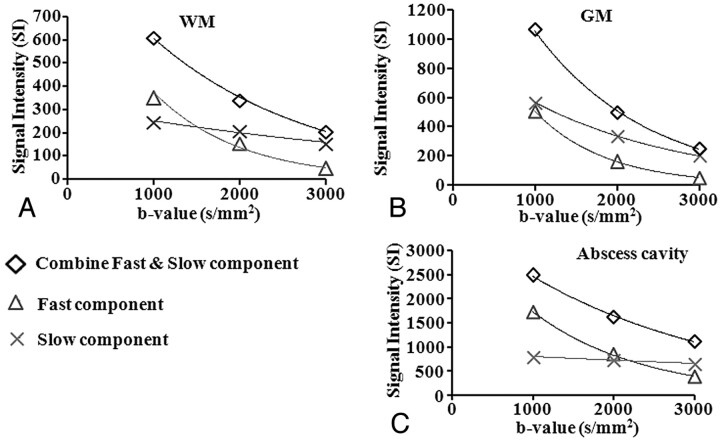
Fig 3.
Graph shows biexponential fitting in the WM (A), GM (B), and abscess cavity (C) of patients with brain abscess. On increasing the b-value, there is a reduction in the signal intensity of combined ADC values and the fast ADC component in WM, GM, and the abscess cavity, but slow ADC component show gradual reduction from GM to WM with not much change in the abscess cavity.

