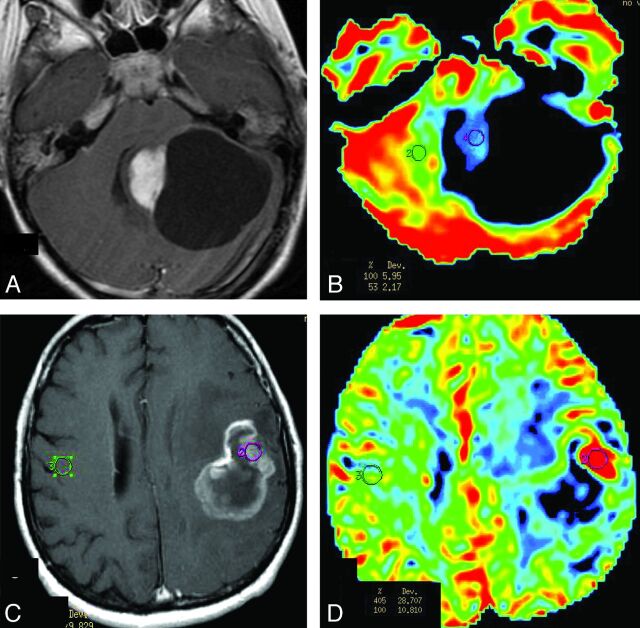
Fig 1.
Comparison of rCBV between PA and HGA on PWI. A and B, Solid-cystic PA in the left cerebellar hemisphere. A, Contrast-enhanced axial T1-weighted imaging demonstrates intense homogeneous enhancement in the solid portion of the tumor and lack of enhancement of the walls of the cystic portion. B, PWI, with an rCBV color overlay map, shows low rCBV on the solid portion of PA. C and D, GBM in the left frontoparietal lobe. C, Contrast-enhanced axial T1-weighted imaging demonstrates ring and irregular peripheral enhancement with central necrosis. D, PWI with an rCBV color overlay map shows increased rCBV in the solid tumor area.

