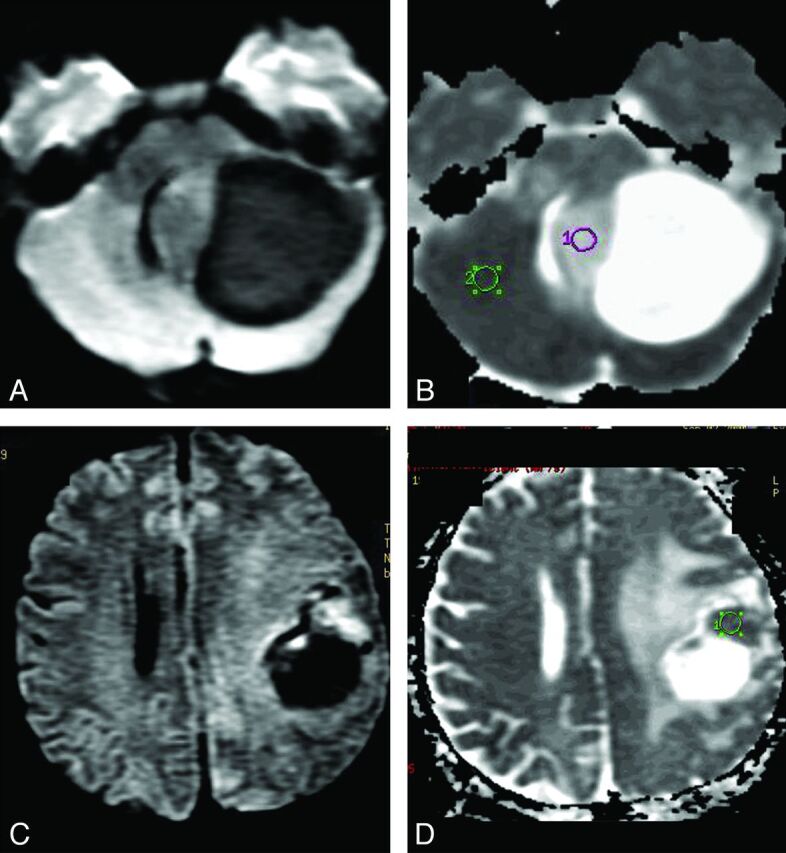
Fig 2.

DWI in PA and HGA. A and B, Solid-cystic PA in the left cerebellar hemisphere. The solid part of this tumor is hypointense on DWI (A) and hyperintense on ADC map (B) in comparison with normal brain parenchyma. C and D, The frontoparietal HGA (GBM) shows decreased water diffusion (C) in the more hyperintense solid tumor area on DWI, which is more hypointense (D) on ADC than the normal brain parenchyma and indicates greater cellularity of this GBM than is observed in the PA shown (A and B).
