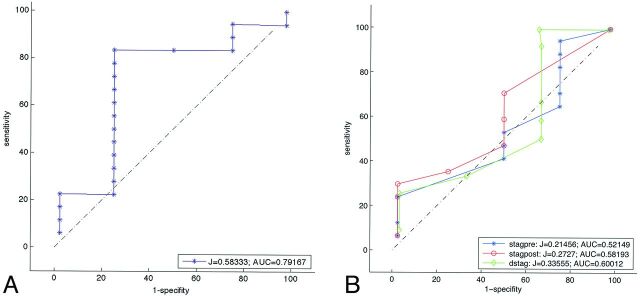
Fig. 2.
A, Receiver operating characteristic analysis curve of the MAFA ratio with respect to thrombosis (follow-up at 12 months for 21 patients). The test against the value 1.03 significantly predicts thrombosis (P = .035). B, Receiver operating characteristic analysis curves for wash-in/washout stagnation characteristic times at 12 months of follow-up: blue (stagpre, the stagnation time before stent placement), red (stagpost, the stagnation time after stent placement), green (dstag, the difference between the post- and prestent stagnation times). Stagnation is not a significant predictor of thrombosis (P > .05).

