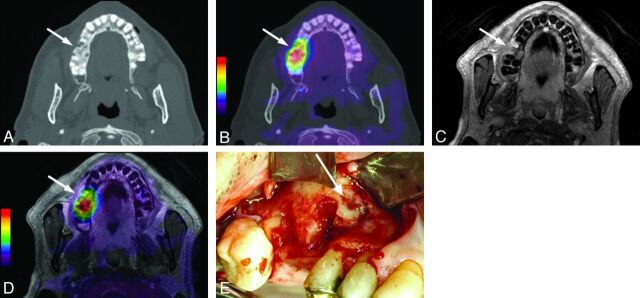
Fig 1.
Transaxial images of the upper jaw from patient 9 with BONJ in the right maxilla (regions 14–15). A, Axial CT image in a bone window depicting osteolysis and fragmentation of bone in a BONJ focus (arrow). B, CT image with fused [18F] fluoride PET signal indicating increased [18F] fluoride uptake (arrow) overlapping the morphologic BONJ focus in A. C, Axial contrast-enhanced T1-weighted MR image with fat saturation shows slightly increased contrast uptake of the BONJ focus without marked soft-tissue involvement (arrow). D, CEMR image with fused [18F] fluoride PET signal indicates slightly larger BONJ extent than expected from the CEMR image alone (arrow). E, Clinical intraoperative examination confirms BONJ in regions 14–15 of the right maxilla (white arrow).

