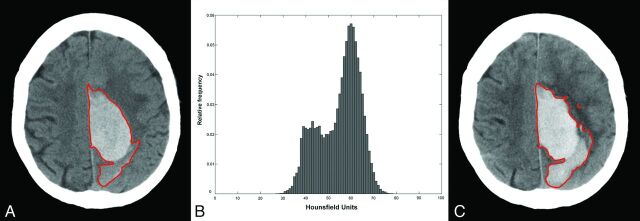
Fig 1.
A, Baseline CT scan obtained 85 minutes post-ictus with a volume of 62 mL (region of interest in red). B, Hounsfield unit histogram (mean, 54.9; SD, 41; coefficient of variation, 0.75; skewness, −0.47; kurtosis, 2.27). C, Follow-up 24-hour CT scan, with 16-mL total ICH growth, predicted to within 5 mL of actual growth by a model based on BV/TTS and within 1 mL of actual growth by a model based on BV/TTS/coefficient of variation. Note that overall study results are tested on a cross-validation-derived dataset (see text).

