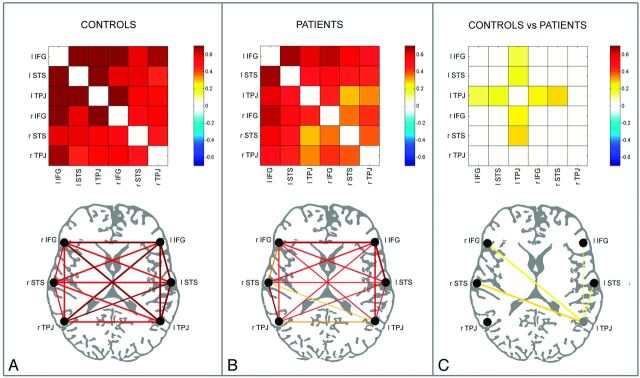
Fig 2.
Controls (n = 13) (A) and patients (n = 39) (B) color-coded cross-correlation matrices (upper row) and connectivity plots (lower row), representing fcMRI statistically significant links among the 6 ROIs of the LN in the 2 hemispheres through a color-scale, ranging from white (z = 0) to dark red (z = 0.7) or lines of variable thickness and colors according to the z scores, from Pearson coefficient values, respectively. Only statistically significant correlations are shown (P < .01). Cross-correlation matrices and connectivity plots representing the statistical comparison between control and patient groups are shown in C (independent-samples t test, P < .01); in the connectivity plot, the lines of variable thickness and yellow tones indicate significantly reduced fcMRI links in patients compared with controls.

