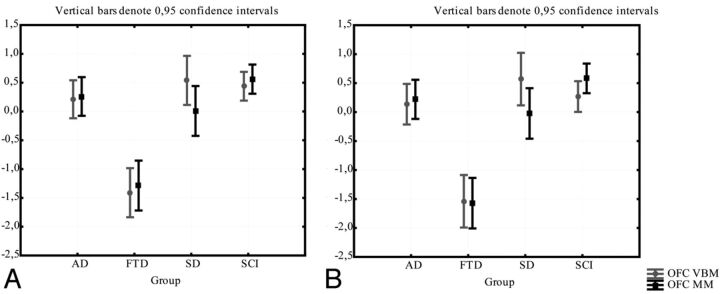
Fig 5.
The comparison between the manual and VBM methods for the orbitofrontal cortex. Gray matter intensity (from VBM) and the volume/intracranial volume (from the manual method) are normalized as z-scores for comparison. Comparison between methods in the (A) left and right (B) orbitofrontal cortex.

