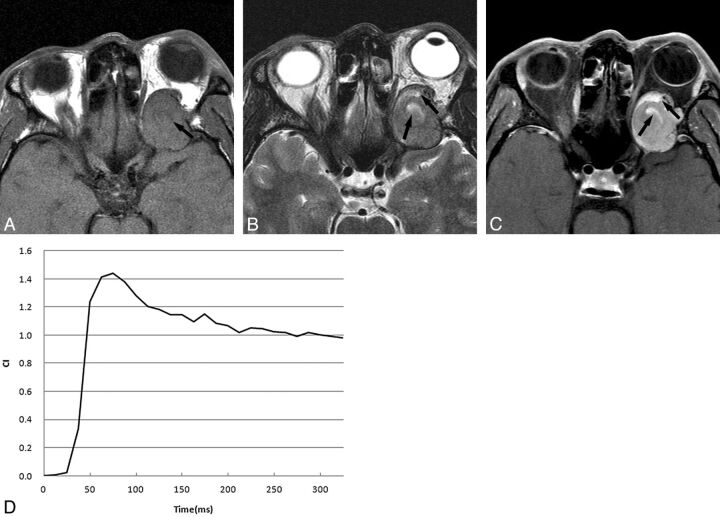
Fig 1.
A 43-year-old man with SFT. A, Axial T1-weighted image shows an oval isointense tumor relative to muscle with some hypointense areas (arrow). B, Axial T2-weighted image reveals that the tumor is isointense relative to muscle with some very high-signal-intensity areas (arrows); the signal of these areas are similar to that of CSF. C, Postcontrast axial MR image with fat saturation shows that the tumor enhances heterogeneously with some markedly enhanced areas (arrows), which are the very high-signal-intensity areas shown on T2-weighted imaging. D, The time-intensity curve for this patient is characterized as a washout curve.

