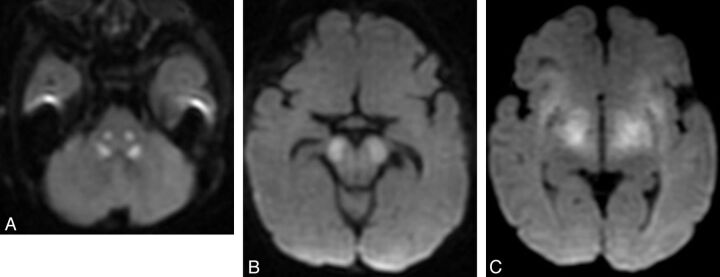
Fig 10.
Diffusivity changes in mitochondrial disorder. Axial DWI images show brain stem reduced diffusion in the central tegmental tracts (A), cerebral peduncles (B), and subthalamic regions. Single-voxel proton MR spectroscopy (C) from the same patient shows reduced NAA and markedly elevated lactate (doublet at 1.33 cpm).

