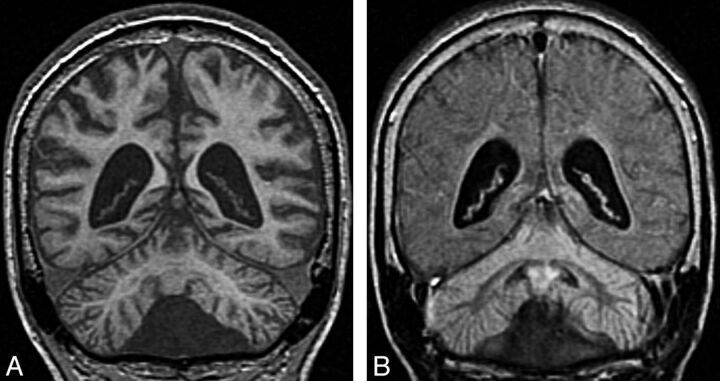
Fig 3.
Infantile neuronal ceroid lipofuscinosis. Coronal T1 image (A) shows cerebral and cerebellar atrophy. Coronal FLAIR image (B) demonstrates diffuse abnormal signal intensity affecting the cortex of both cerebellar hemispheres. Compare the signal intensity of the cerebellar cortex with occipital cortex.

