
Fig 2.
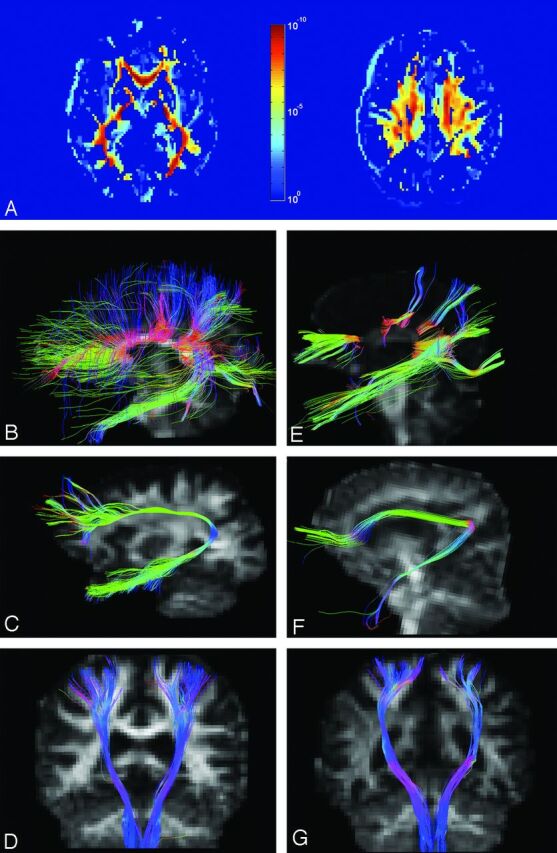
P value map and tractography in patients and controls. A, P value map shows significant differences in microstructure integrity of white matter between patients and controls. B–D, Reconstructive tracts of the CC, arcuate fasciculus, and CST in a control subject. E–G, Corresponding tracts in patient 3.